Resource Overview
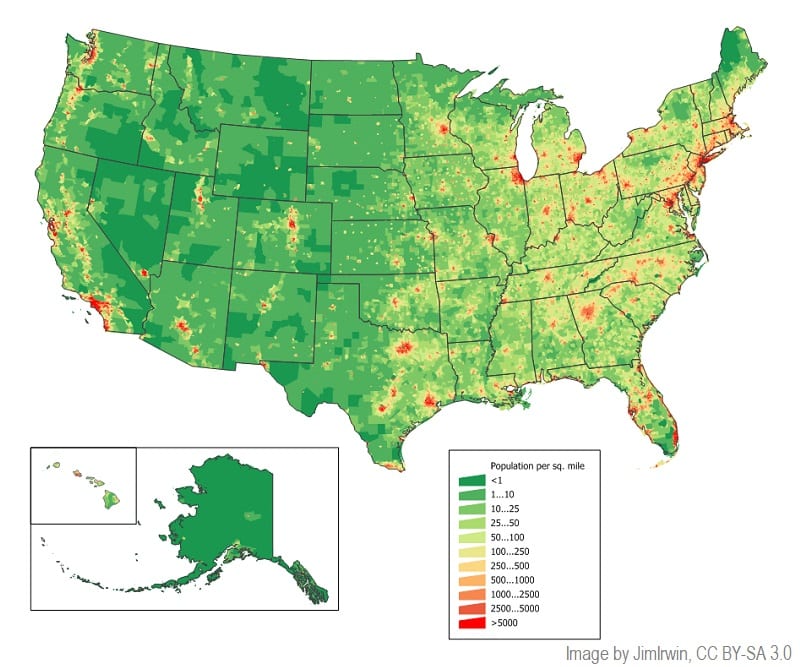
Students create a population density map of the United States to visually represent how density has increased and how the country’s population has redistributed since the year 1800.
Students will be able to:
- Create a state-level density map of the U.S. from 1800 to the present and forecasted to 2040.
- Analyze population density and migration by observing historical data.
- Make correlations between the nation’s geography and population settlement patterns.
- Interpret a county-level population density map of the United States.

Features of This Resource
- Lesson plan utilizes students’ mapping skills
- Students identify trends and patterns between time periods
- Great lesson for teaching about U.S. history and U.S. geography
Supplemental Materials

How Do I Get This Lesson Plan?
The resource is free. Click the green button for immediate download. Download Now
Other Resources You Might Like:
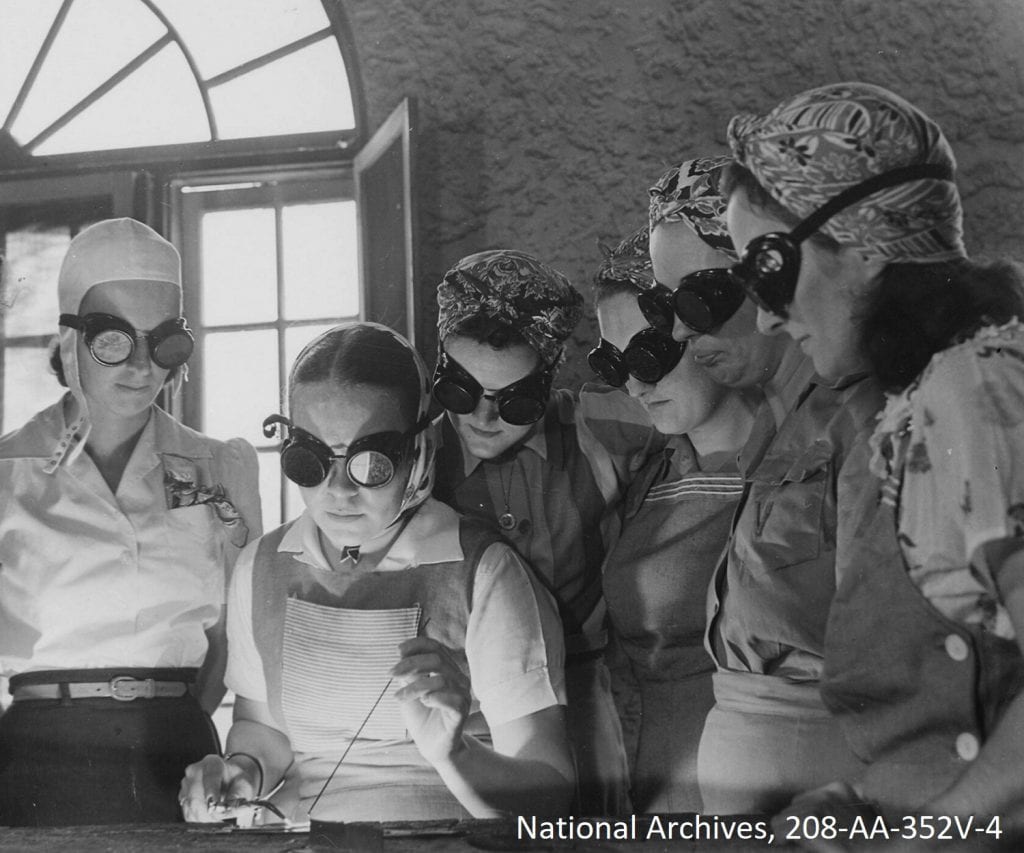
Students examine current and historic U.S. gender roles through two short mental exercises and research.
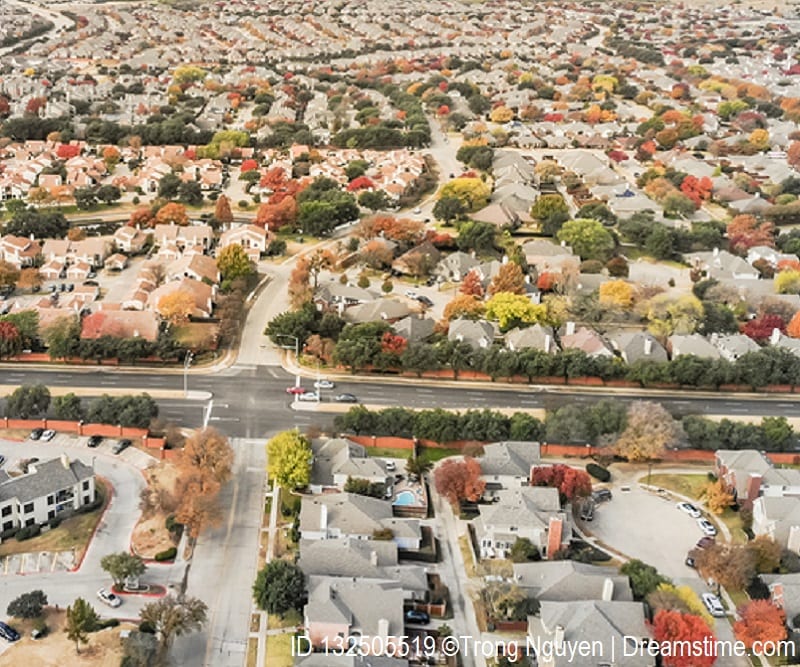
Students read a news article about local population growth and the resulting sprawl, create and write a proposed solution, and... Read more »
Students demonstrate the effects of crowding in a “jumping jack” activity, discuss the pros and cons of population density, and... Read more »
Nice to meet you!
Tell us a bit about yourself so we can continue creating resources that meet your needs.
You’ll only need to fill out this form once. If you’ve already completed the form, you can confirm your email here.