Resource Overview
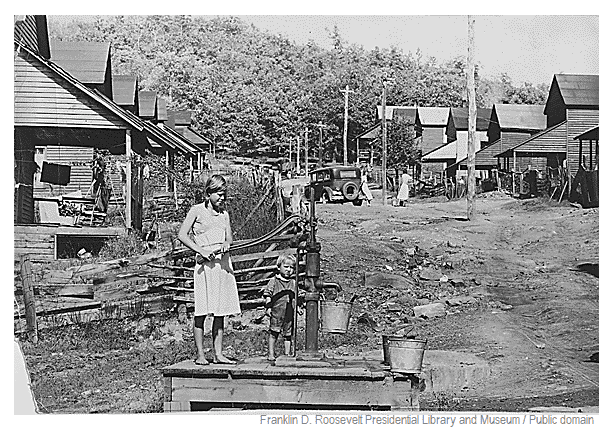
Students experience the changing pace of U.S. population growth by simulating the country’s population growth since the first census in 1790.
Students will be able to:
- Describe U.S. population growth trends from 1790 to present.
- Identify projected trends in U.S. population growth through 2050.
- Discuss factors that demographers consider when making population projections.

Features of This Resource
- Great lesson plan for U.S. History
- Large group simulation of changes in U.S population size
- Lesson is scalable for middle or high school
Supplemental Materials

How Do I Get This Lesson Plan?
The resource is free. Click the green button for immediate download. Download Now
Other Resources You Might Like:

Students experience the changing pace of population growth by actively simulating the Earth’s population growth over a 500-year span. Students... Read more »
Acting as presidents from various points in history, students compare U.S. demographic and environmental statistics.
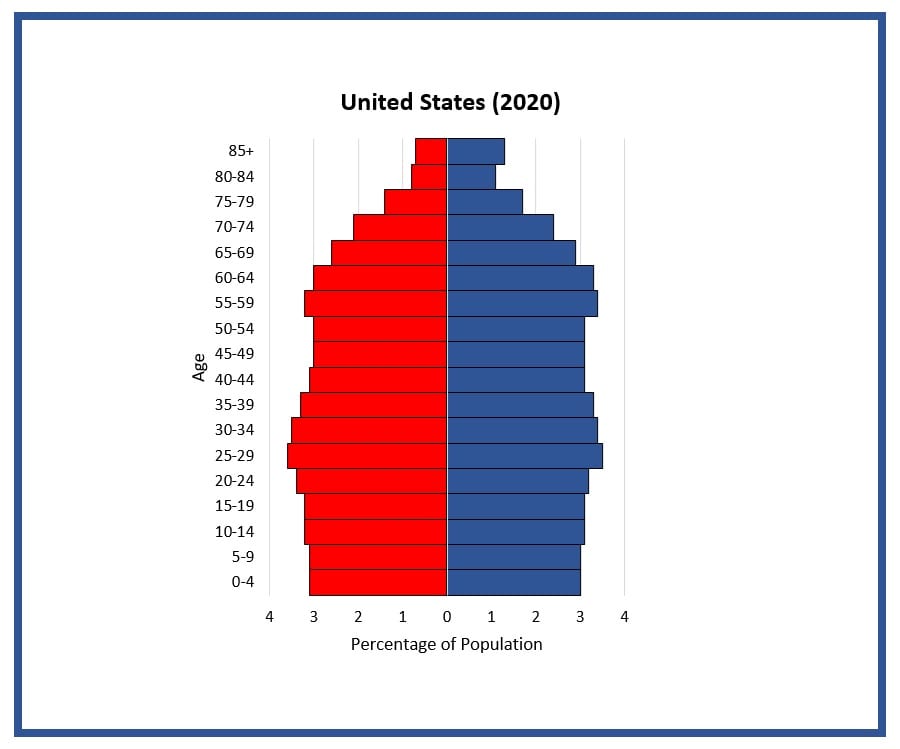
Students construct and interpret population pyramids (age-sex distribution charts) and discuss differences in population characteristics at different points in U.S.... Read more »
Nice to meet you!
Tell us a bit about yourself so we can continue creating resources that meet your needs.
You’ll only need to fill out this form once. If you’ve already completed the form, you can confirm your email here.