Current World and U.S. Population
Human Population is increasing. See how quickly the number of people changes right before your eyes.Popular Resources

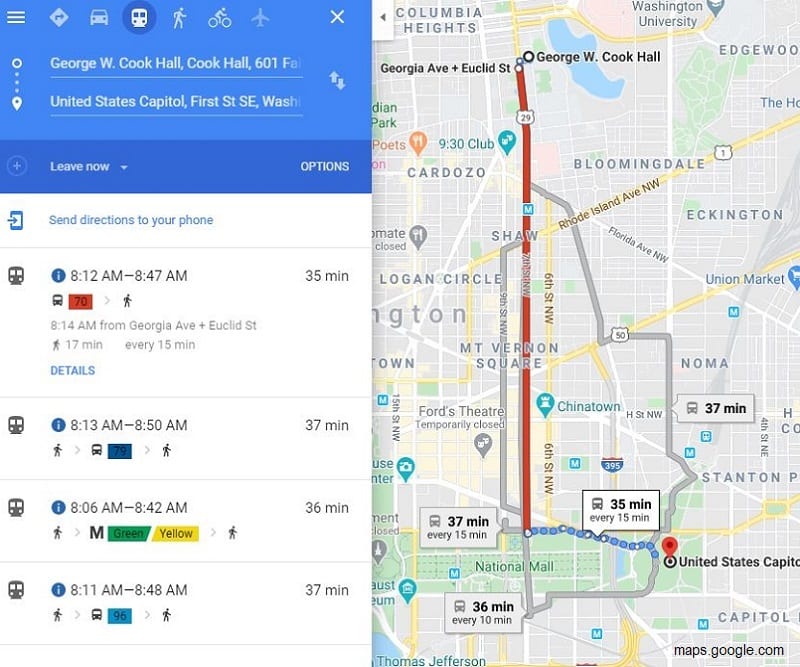
Students participate in a "push/pull" simulation to identify reasons people migrate from one place to…
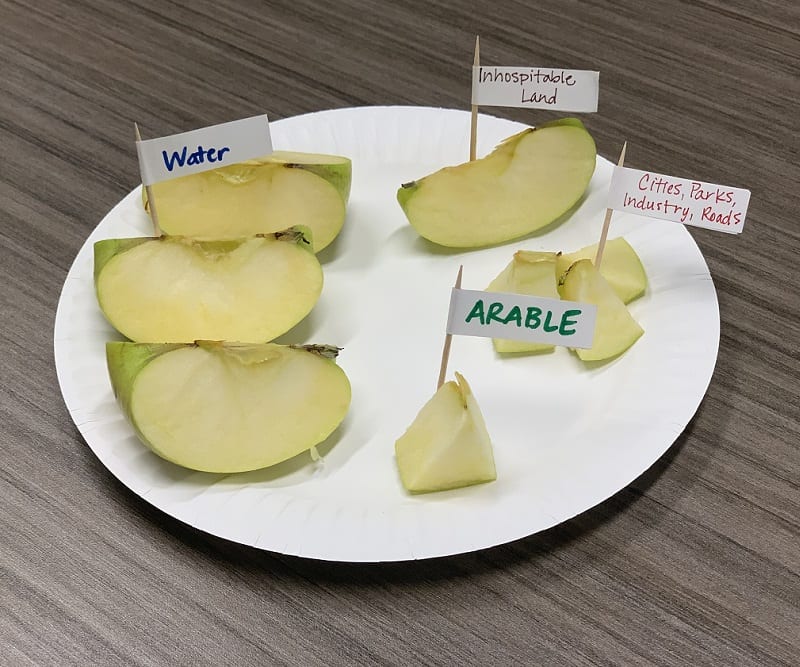
An apple is sliced into pieces to model the amount of agricultural land being used…
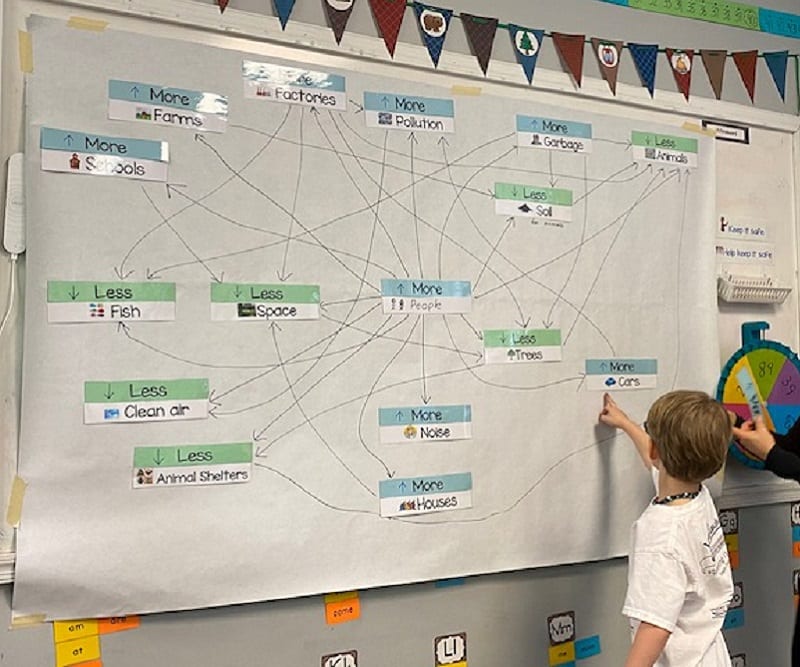
Students construct a word web to show the possible cause and effect relationships of a…
The latest from PopEd
Video Contest
Challenge your students to address some of today's most pressing issues, and offer their own solutions, through film. This project-based approach offers inquiry and critical thinking on real-world topics. Read More
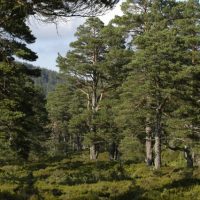
Monthly theme: Forests
Follow #PopEdForests for lessons plans, resources, and a free teacher webinar all about forests. Perfect materials for Earth Day! Read More
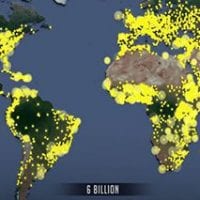
Population "Dot" Video
Watch population dots light up on an illustrated map, representing millions of people added to the Earth as a digit clock rolls through the years from 1 CE to 2050. GIS update is now more accurate than ever. Read More

Online Graduate Course
Acquire student-centered learning strategies and activities to explore the impact of human population growth in a flexible online setting. Earn 45 clock hours and/or 3 graduate credits in four weeks this summer. Read More

TEACHER WORKSHOPS
Fun PDs for current and future teachers
In-person and online training workshops are held for public and private schools, non-formal education sites, and on university campuses. No matter the venue, participating educators will engage in interactive classroom activities and fine connections to their unique classroom needs.
Request a Workshop Attend a Virtual Workshop